基本操作
>> t = [0:0.01:0.98];
>> y1 = sin(2*pi*4*t);
>> plot(t, y1)
>> y2 = cos(2*pi*4*t);
>> plot(t, y2)

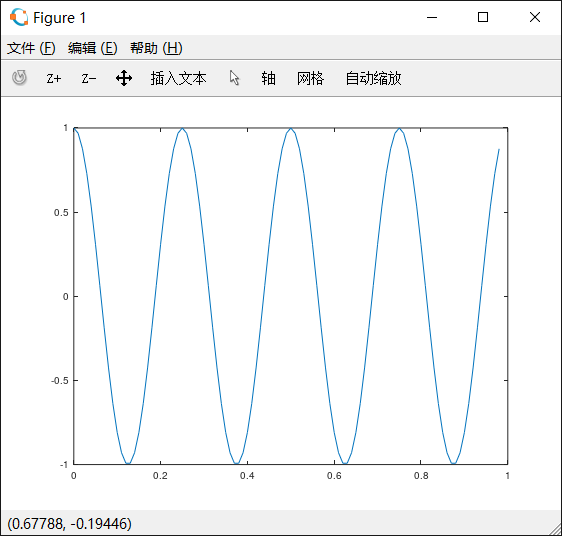
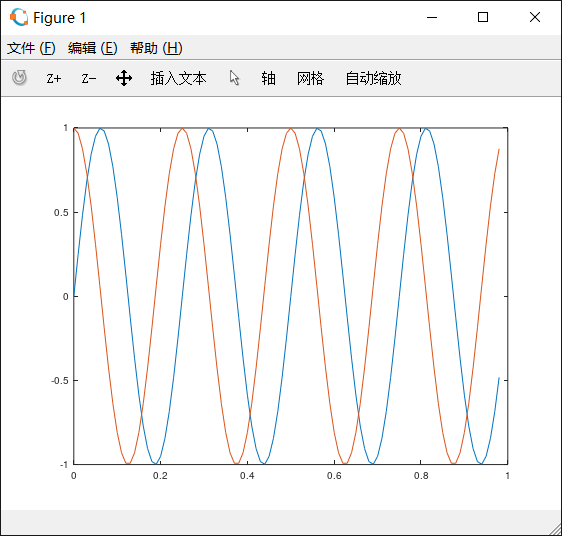
`>> t = [0:0.01:0.98];
>> y1 = sin(2*pi*4*t);
>> plot(t, y1)
>> hold on
>> y2 = cos(2*pi*4*t);
>> plot(t, y2)
>> close  % 关闭图表
>> figure(1)  % 打开或切换到图表1,对其进行操作
>> plot(t, y1)
>> figure(2)  % 打开或切换到图表2,对其进行操作
>> plot(t, y2)
格式化参数
- 调用方式:plot(X, Y, FMT)
-
FMT是一个字符串,由几个可选项组成:”<linewith><marker><color><marker><color><displayname>“,以下为官方帮助文档中参数各可选项的可选值。(color中的‘blacK’首字母没大写!:unamused:)
Format arguments:
linestyle
’-‘ Use solid lines (default). ’–’ Use dashed lines.
’:’ Use dotted lines.
’-.’ Use dash-dotted lines.marker
’+’ crosshair
‘o’ circle
‘*’ star
’.’ point
‘x’ cross
’s’ square
‘d’ diamond
’^’ upward-facing triangle
‘v’ downward-facing triangle
’>’ right-facing triangle
’<’ left-facing triangle
‘p’ pentagram
‘h’ hexagramcolor
‘k’ blacK
‘r’ Red
‘g’ Green
‘b’ Blue
‘y’ Yellow
‘m’ Magenta
‘c’ Cyan
‘w’ White“;displayname;”
Here “displayname” is the label to use for the plot legend .
其他操作
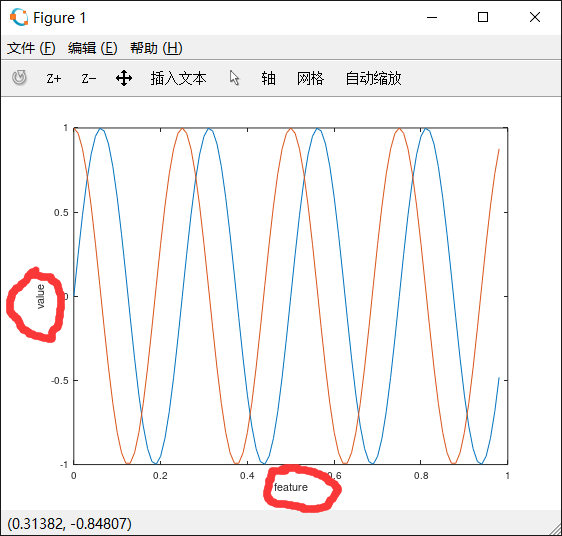
>> xlabel('feature')  % 为刚刚生成的图表动态添加x轴的名字
>> ylabel('value')  % 为刚刚生成的图表动态添加y轴的名字
>> legend('sin', 'cos') % 给绘制的两条线命名,也可通过plot函数的FMT参数中的<;displayname;>这一项,在一开始就命名
 ’)
’)
>> title('my plot') % 动态添加图表的名称
 ’)
’)
>> subplot(4, 4, 1)  % 将画板按4*4矩阵划分,将子图放在第一块上
>> plot(t, y1) % 在该子图上绘图
>> subplot(2, 2, 4)  % 将画板按2*2矩阵划分,将子图放在第四块上。
>> plot(t, y2)  % 在该子图上绘图

>> axis([-1 1 -0.5 1]) % 设置x轴和y轴的取值范围:x∈[-1, 1], y∈[-0.5, 1]
![aixs(p-1 1 0.5 1]) set_axis](/blog/assets/2019/02/09/plotting_data/axis.png)
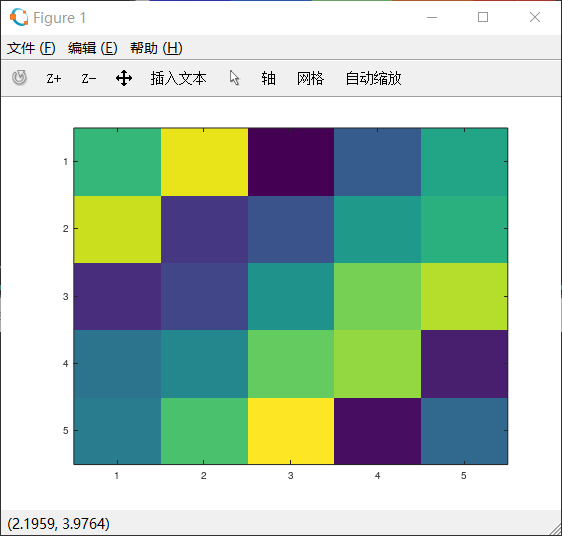
>> A = magic(5)
A =

   17   24    1    8   15
   23    5    7   14   16
    4    6   13   20   22
   10   12   19   21    3
   11   18   25    2    9

>> imagesc(A)  % 根据矩阵的值给矩阵各块上色
>> colorbar  % 在右侧添加色度条
>> colormap gray;  % 选取要映射的颜色表
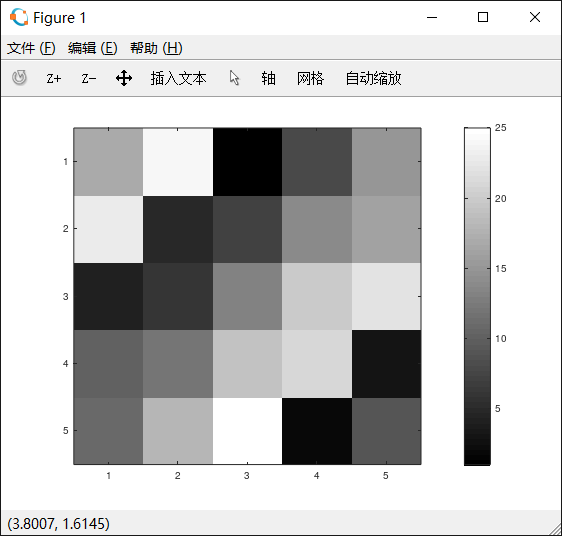
>> clf % 清空当前图表,使得可以在该窗口重新绘制另一个图表
保存
>> cd E:\Octave\octave_folder; print -dpng 'myPlot.png'
>>  % print后的可选项格式为:d + 图片类型后缀名